How to Increase Restaurant Profit Without Cutting More Costs
See how more orders can move the same restaurant from a loss to a 40% operating margin. Explore the visual example and calculate it with your own numbers.
If you've already controlled waste, negotiated your costs and staffed sensibly, the next way to increase restaurant profit is to sell more through the restaurant you're already paying to operate.
Your rent doesn't get cheaper because Tuesday is quiet. Fewer orders just means each one has to carry more of it. Bring in more orders without increasing that overhead, and each order carries less. That's how volume creates margin without raising your prices or cutting the quality of your food.
The same restaurant can have a −20% operating margin at low volume and a 40% margin at high volume. That means an average $5 operating loss per $25 order versus $10 in operating profit per order, with the same prices, per-order costs and monthly overhead. The worked example below shows how, assuming the restaurant has room to serve the extra business.
Use your numbers in the profit calculator
You don't need to pay the same rent again for the next order
You're paying for the space whether the dining room is half empty or full. Your insurance and kitchen equipment lease don't double when you sell twice as many meals. Some staffing is already committed just to open, prep and run the restaurant.
When order volume is low, too few sales are carrying those costs. A dish can leave a healthy amount after ingredients and still contribute to a restaurant that barely makes money overall.
More orders spread the existing overhead across more sales. That doesn't mean every cost stays the same. Ingredients, packaging and payment fees grow with the orders. Utilities have both a baseline cost and usage that rises. Labor can stay similar while the existing team has room to do more, then increase when you need another person or shift.
The useful distinction is between costs you already incur and costs the additional business would create. Accountants call this fixed, variable and mixed cost behavior. For an owner, it answers a practical question: how much of the next order could you actually keep?
Know which costs the next order adds
Already paid to open
- Rent
- Insurance
- Equipment lease
Added with each order
- Food
- Packaging
- Payment fees
Same overhead. More orders to share it.
Imagine $20,000 in monthly fixed overhead. The bill stays at $20,000 in each scenario below. What changes is how much of it each order has to cover.
Same $20,000 bill. A smaller share per order.
Fixed overhead per order = monthly fixed overhead ÷ monthly orders
At 1,000 orders, each order carries $20 of overhead before you pay for the food. At 4,000 orders, it carries $5. You haven't cut the rent. You've spread it across more business.
This is an illustrative comparison, not a forecast that you can quadruple orders with the same team. Hold overhead constant only while the restaurant has the capacity to handle those orders.
What the next order actually leaves
At break-even, your sales cover both the cost of serving those orders and the overhead of operating the restaurant. You have not made a profit yet, but you have covered those costs.
The next order still needs ingredients and service. It does not need to pay the same monthly rent again. With overhead unchanged, the amount left after the costs of acquiring and serving that additional order increases operating profit. That's the basis of break-even analysis.
Here is a hypothetical extra order. Sales exclude tax and tips; the costs include ingredients, applicable packaging and fees, additional labor and marketing needed to generate it.
Where the next $25 goes
That 60% is the contribution from an additional order. The restaurant's overall operating margin also accounts for the monthly overhead. In the example below, it ranges from a 20% loss to a 40% profit, depending on how many orders share that overhead.
These are illustrative numbers, not restaurant benchmarks. A delivery order with a large commission could leave far less. If an order costs more to acquire and serve than it brings in, selling more of it increases the loss.
Same restaurant. A loss at one volume, 40% margin at another.
Imagine one restaurant with $20,000 in monthly overhead, including the space and baseline staffing needed to operate. It sells a $25 order. Attracting the customer and serving that order adds $10 in food, packaging, fees and any labor or marketing that varies with the sale.
Compare 1,000 orders a month with 4,000. The only change is order volume: the price, the $10 cost per order and the $20,000 monthly overhead stay the same. This illustration assumes the existing team, kitchen and space can handle the additional orders.
Same $25 order. −20% margin or 40% margin.
Low volume
1,000 orders/month
- Same order
- $25.00
- Attract the customer and serve their order
- −$10.00
- Allocated overhead
- −$20.00
−20%
operating margin
−$5 per order
average operating loss
$5,000/month
operating loss
High volume
4,000 orders/month
- Same order
- $25.00
- Attract the customer and serve their order
- −$10.00
- Allocated overhead
- −$5.00
40%
operating margin
$10 per order
average operating profit
$40,000/month
operating profit
At low volume, overhead takes $20 out of each $25 sale. Add the $10 cost of generating and serving the order, and the restaurant loses $5 per order on average. At high volume, overhead falls to $5 per order. The same $25 sale now leaves $10 in operating profit: a 40% margin.
The food and marketing bills still grow with volume. Total per-order costs rise from $10,000 to $40,000 a month. What stays at $20,000 is the overhead, now shared across four times as many orders.
See the monthly calculation
Low volume: 1,000 × ($25 − $10) − $20,000 = −$5,000.
Operating margin: −$5,000 ÷ $25,000 sales = −20%.
High volume: 4,000 × ($25 − $10) − $20,000 = $40,000.
Operating margin: $40,000 ÷ $100,000 sales = 40%.
100 more orders a day. A $45,000 monthly profit swing.
100more orders a dayEach icon represents 10 orders
3,000more orders in 30 days100 a day × 30 days
+$45,000change in monthly operating profit3,000 × $15 contributionFrom a $5,000 loss to $40,000 profit
This is a fourfold increase in monthly orders, not a forecast that a small campaign will create a 40% margin. The point is what profitable volume can do when capacity is underused. Your own result depends on whether you can generate those orders at that cost and serve them without a bigger increase in expenses.
Calculate the extra orders your own profit target requires
Start with the increase in monthly operating profit you want, then work out what each additional order would contribute.
Additional orders needed = desired increase in operating profit ÷ contribution per additional order
For a hypothetical $3,000 increase in monthly operating profit, the order target changes with what each order leaves after its additional costs.
Same $3,000 profit increase. Different order target.
Each block = 50 extra orders per month
$15left per order
200orders/month$3,000 ÷ $15
$6left per order
500orders/month$3,000 ÷ $6
Use your actual menu mix and sales channels. An extra dine-in check and an extra delivery order may leave different amounts. Include the cost of attracting the business, not just producing the food. If a campaign adds a fixed monthly software or management fee, add that fee to the profit increase you want before dividing by the contribution per order. Count each cost once.
An increase in profit is different from a final profit target. In the loss-making restaurant above, a $3,000 improvement would still leave a $2,000 loss. To finish with $3,000 in monthly operating profit, first cover the existing $5,000 loss.
Close the loss first, then build profit.
−$5,000loss
$0break-even
+$3,000profit
$5,000to cover the loss
$3,000to build profit
$8,000 additional contribution needed
At $15 contribution per order, you need at least 534 extra orders to reach that $3,000 monthly profit target. The next question is where those orders could fit.
Prioritize the dayparts where you can sell more
An extra ten orders spread across a quiet lunch may be straightforward. Ten more arriving during a kitchen's busiest fifteen minutes may require more staff, slow everyone down or displace higher-value orders.
Look at your quiet dayparts, how many orders the kitchen can handle and existing staffing before choosing what to promote. If Tuesday dinner has space but Saturday is already full, a campaign that fills Saturday does not solve the same problem. The opportunity may be bringing more customers in on slow weeknights, not increasing demand everywhere equally.
Price the next capacity increase before committing to it. Suppose the 3,000 extra orders require another $15,000 a month in staffing. The extra labor belongs either in the per-order estimate or as this separate increase, not both. Here is how that changes the result.
More staff changes what you keep.
$45,000 contribution from 3,000 extra orders
$15,000added staffing
$30,000increase in operating profit
$45,000 contribution − $15,000 added staffing = $30,000 improvement. Starting from a $5,000 loss, the restaurant now makes $25,000 on $100,000 in sales: a 25% operating margin.
Now you know how many orders you want, what you can spend to generate them and when you can serve them. That makes choosing a marketing strategy much more specific.
What would more volume do to your margin?
Try your own numbers. Compare operating margin and monthly profit, including any new costs the extra volume requires.
Illustrative example loaded. Replace these figures with your own.
Check your numbers
Your inputs stay in this page. No email required.
Illustrative example: 1,000 current orders plus 3,000 extra orders per month, at $25 per order, $10 cost per order, $20,000 overhead and $0 additional fixed costs.
Current operating margin
−20%
−$5,000 monthly operating profit
Operating margin with the extra orders
40%
$40,000 monthly operating profit
Change in monthly operating profit
+$45,000
Left from each extra order before additional fixed costs: $15
3,000 extra orders × ($25 order value − $10 cost per order) − $0 additional fixed costs = $45,000
See the full monthly breakdown
| Measure | Current | With extra orders |
|---|---|---|
| Monthly orders | 1,000 | 4,000 |
| Sales | $25,000 | $100,000 |
| Per-order costs total | $10,000 | $40,000 |
| Fixed costs | $20,000 | $20,000 |
| Operating profit | −$5,000 | $40,000 |
This is an estimate, not a sales forecast. It assumes the same order value and per-order costs, with enough capacity to serve the extra orders. Operating margin is operating profit divided by sales. Profit is before interest and income tax; margin is undefined when sales are zero.
Do you need more new customers, more repeat visits, or both?
Before deciding how to get those extra orders, look at who is already coming in and whether they come back. Two numbers help you decide where to focus: your new-versus-returning customer mix and your return rate.
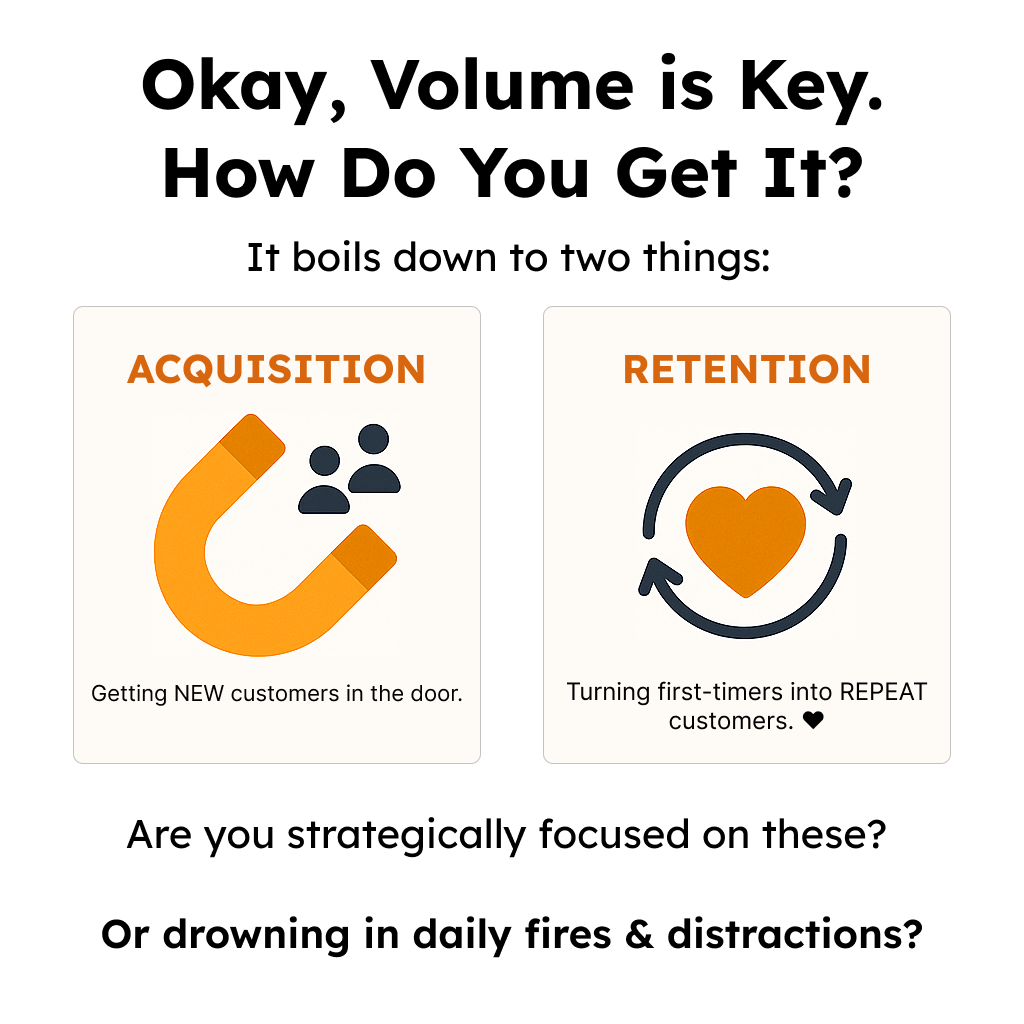
Your customer mix shows how many of the guests you can identify in a period are new to your records and how many have visited before. Look at the counts as well as the percentages. A restaurant can have a high share of regulars because those guests love it, or because hardly anyone new is discovering it.
Your return rate answers a different question: what percentage of first-time guests make a second visit? Then check what percentage return after their second visit, their third, and so on. That pattern shows where you are losing guests and when people start returning more consistently.
Give each group the same amount of time to return. Someone who first visited yesterday has not had the same opportunity as someone who came a month ago. Use the guests you can consistently identify, and remember that a first recorded visit may not be their first-ever visit. The guide to restaurant retention rates explains the calculation.
If new guest counts are low but people who try you keep coming back, focus on introducing the restaurant to more people. Local ads or food influencers can help you reach them. Promote a dish or occasion in a daypart where you have room to sell more.
If plenty of new guests arrive but few return, focus on the first-visit experience and the next invitation. Find out why they are not coming back, then give them a specific reason to visit again. Turning first-time guests into regulars teaches that part. Some restaurants need both more first visits and better follow-up.
This is why tracking matters. It lets you choose a marketing plan based on what your restaurant needs, instead of spending more to solve the wrong problem. As you test that plan, marketing ROI shows whether the extra business is worth its cost. If marketing is already included in your per-order estimate, don't subtract it twice.
Try it with your restaurant's numbers
What would another few hundred orders do for your restaurant? Use your own average order value, costs and customer behavior to work out the opportunity, then compare ways to bring those orders in.
Feast's Revenue Analyzer brings your marketing and POS sales data together. Its Revenue Simulator lets you try different numbers of new customers, repeat visits and marketing investment to see what they would mean for your sales goal. You can change the assumptions and compare the plans yourself.
Pair that sales plan with the costs from your own accounts to work out what the extra orders would leave in profit. Start with the dayparts you have room to grow, and see what it would take to reach the result you want.